

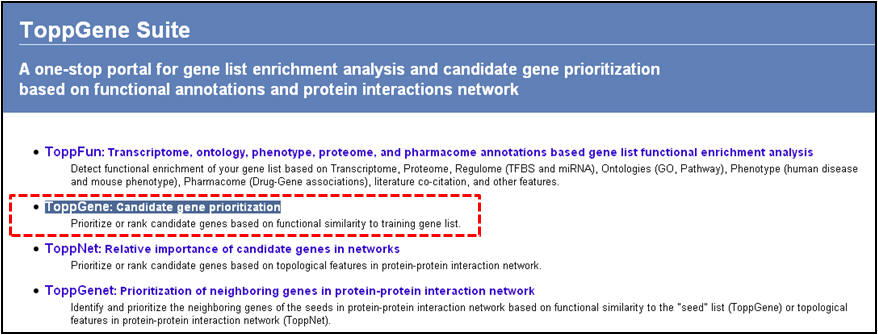
ToppGene Suite (http://toppgene.cchmc.org) is a one-stop portal for (a) gene list functional enrichment, (b) candidate gene prioritization using either functional annotations or network analysis or both, and (c) identification and prioritization of novel disease candidate genes in the interactome. Functional annotation based disease candidate gene prioritization uses fuzzy-based similarity measure to compute the similarity between any two genes based on semantic annotations. The similarity scores from individual features are combined into an overall score using statistical meta-analysis. A p-value of each annotation of a test gene is derived by random sampling from the whole genome. The protein-protein interaction network (PPIN) based disease candidate gene prioritization uses social and Web networks analysis algorithms (extended versions of the PageRank and HITS algorithms, and the K-Step Markov method).
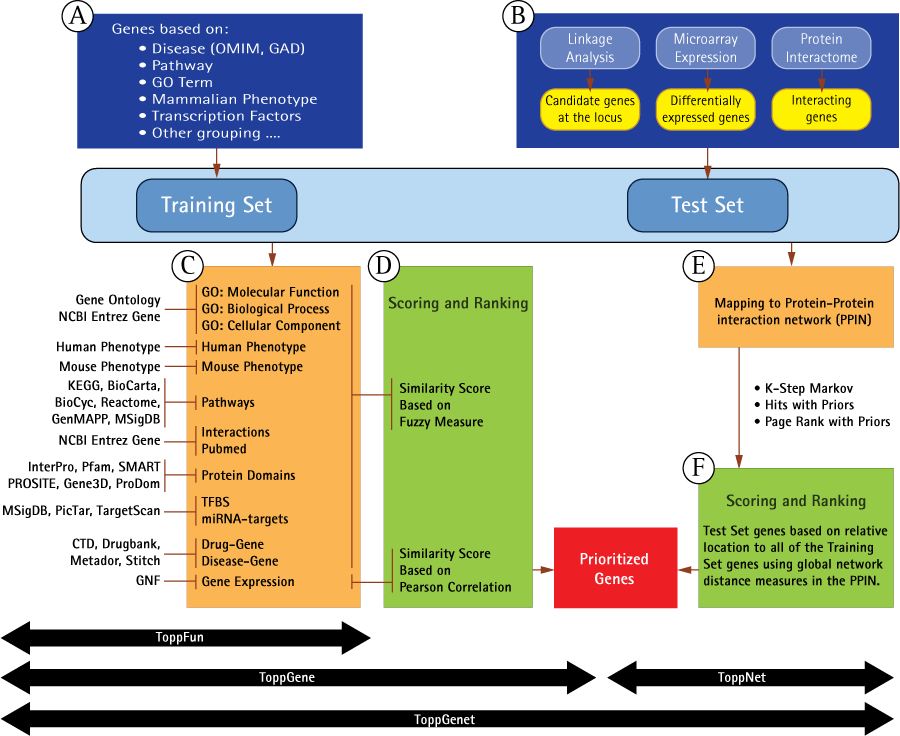
Schematic representation of work flow and methodology in ToppGene Suite applications (A) Genes in the training set are selected based on their attributes or current gene annotations (genes associated with a disease, phenotype, pathway or a GO term). (B) Test gene source can be candidate genes from linkage analysis studies or genes differentially expressed in a particular disease or phenotype or genes from the interactome. (C) ToppFun - Enriched terms of the gene annotations and sequence features, namely, GO: Molecular Function, GO: Biological Process, Mouse Phenotype, Pathways, Protein Interactions, Protein Domains, transcription factor binding sites, miRNA-target genes, disease-gene associations, drug-gene interactions, and Gene Expression, compiled from various data sources, and also used to build training set gene profile. (C and D) ToppGene - A similarity score is generated for each annotation of each test gene by comparing to the enriched terms in the training set of genes. The final prioritized gene list is then computed based on the aggregated values of the fourteen similarity scores. (E and F) ToppNet – Training and test set genes are mapped to protein-protein interaction network. Scoring and ranking of test set genes based on relative location to all of the training set genes using global network-distance measures in the PPIN.
Below is a list of ToppGene Suite applications along with a step-by-step instruction guide in using them.
a. Using ToppFun for gene list enrichment analysis
b. Using ToppGene for disease gene prioritization based on functional similarity to training set genes
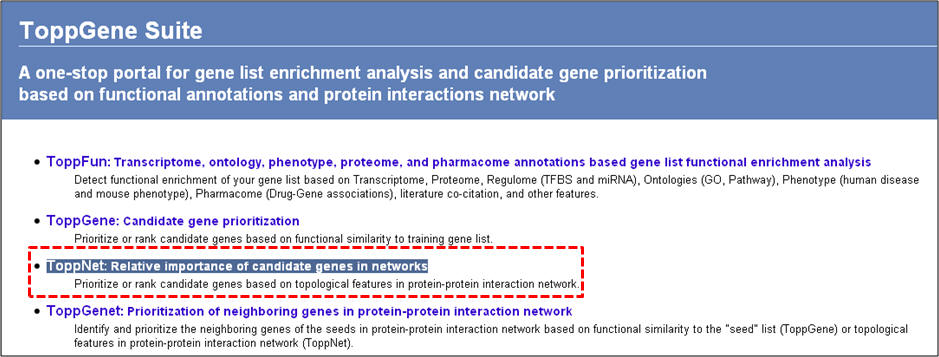
c. Using ToppNet for disease gene prioritization based on topological features in PPIN
a. Using ToppFun for gene list enrichment analysis
Query: To conduct gene list enrichment analysis on obesity-associated genes.
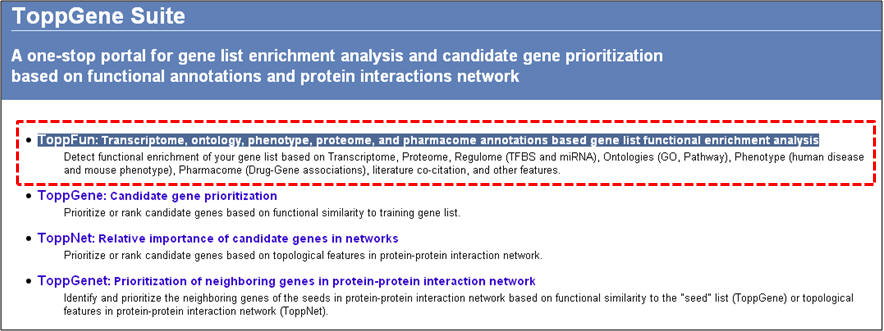
1. From the homepage click on the first link ("ToppFun: Transcriptome, ontology, phenotype, proteome, and pharmacome annotations based gene list functional enrichment analysis")
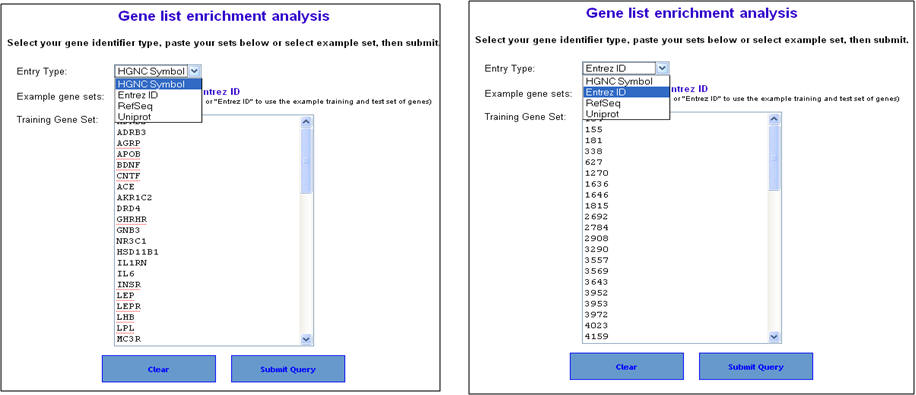
2. On the "Gene list enrichment analysis" enter either human gene symbols or human NCBI Entrez Gene IDs in the box against "Training Gene Set" and click on "Submit Query". ToppGene supports RefSeq and UniProt IDs too. For the list of obesity genes, see the Supplementary File 2.
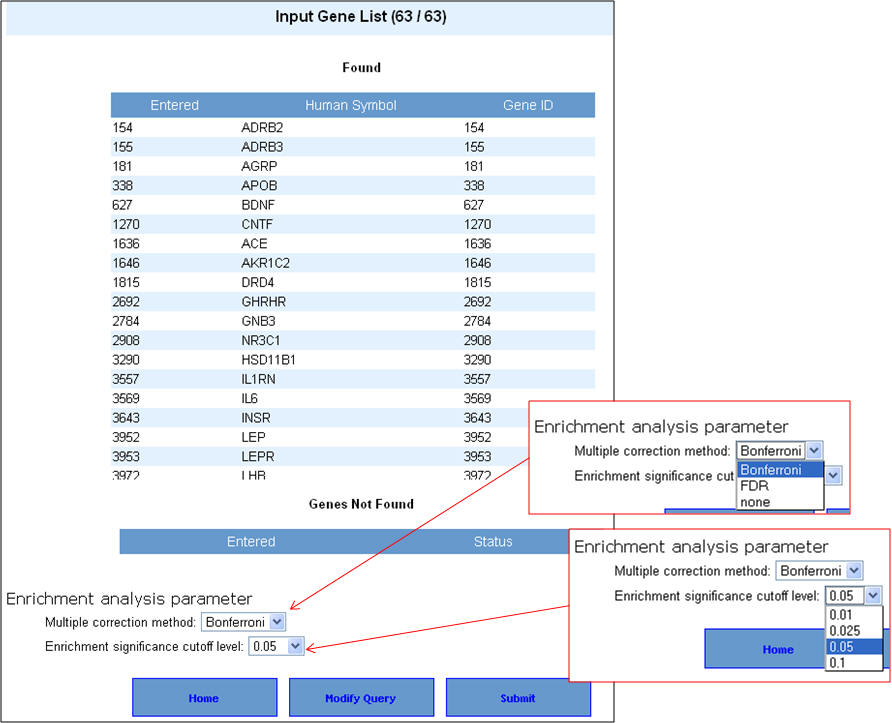
3. You can select the appropriate statistical parameters under the "Enrichment analysis parameter" and then hit "Submit" button. The default parameters are "Bonferroni" for multiple correction method and 0.05 for significance cut-off level. 4. If your gene list contains non-approved symbols or duplicates at this stage, they will be listed under "Genes Not found". You can then resolve this by selecting the appropriate symbols from a list of suggestions (see 4 below).
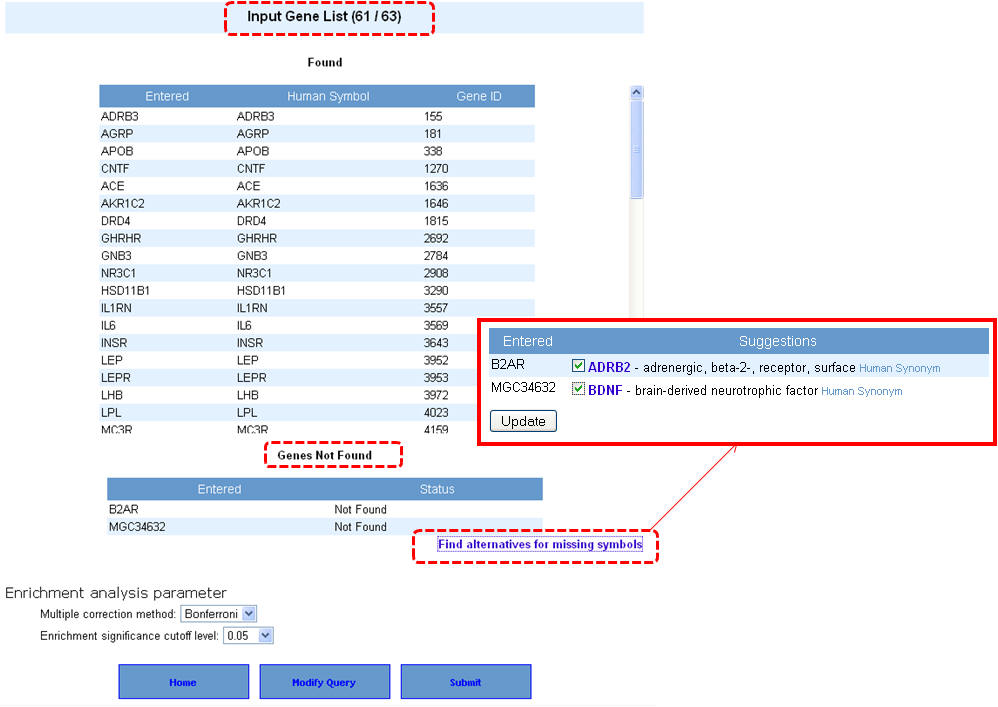
4. If your input gene list contains synonyms or alternate symbols other than approved human gene symbols, you will be prompted to select from a list of alternatives. Once you select the approved symbols, click on the "update" button to allow these genes also to be added back to your input list. This will take back you to the previous screen, wherein after selecting the enrichment analysis parameters you can proceed with the analysis by clicking on "submit" button.
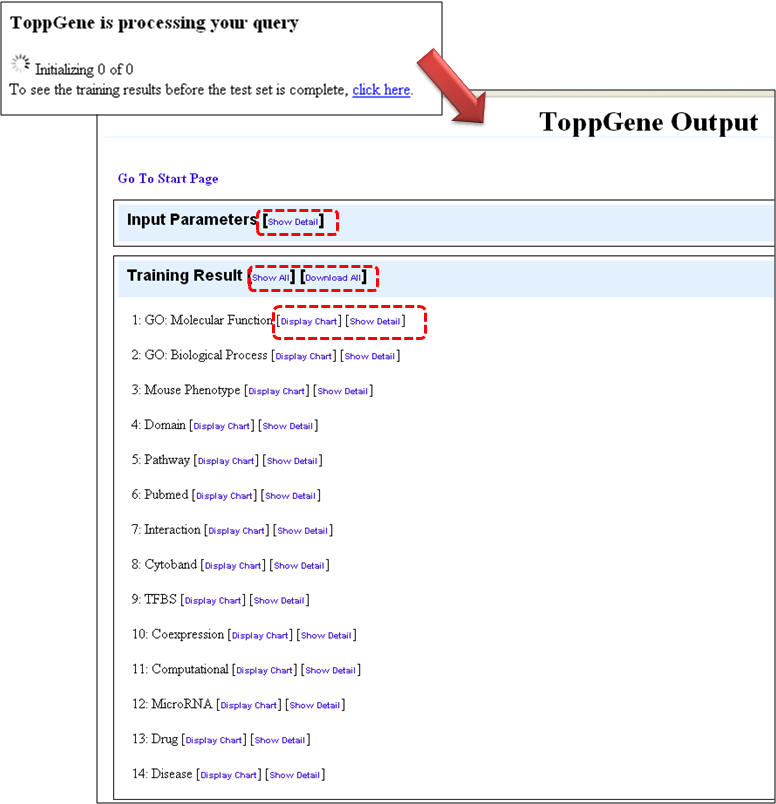
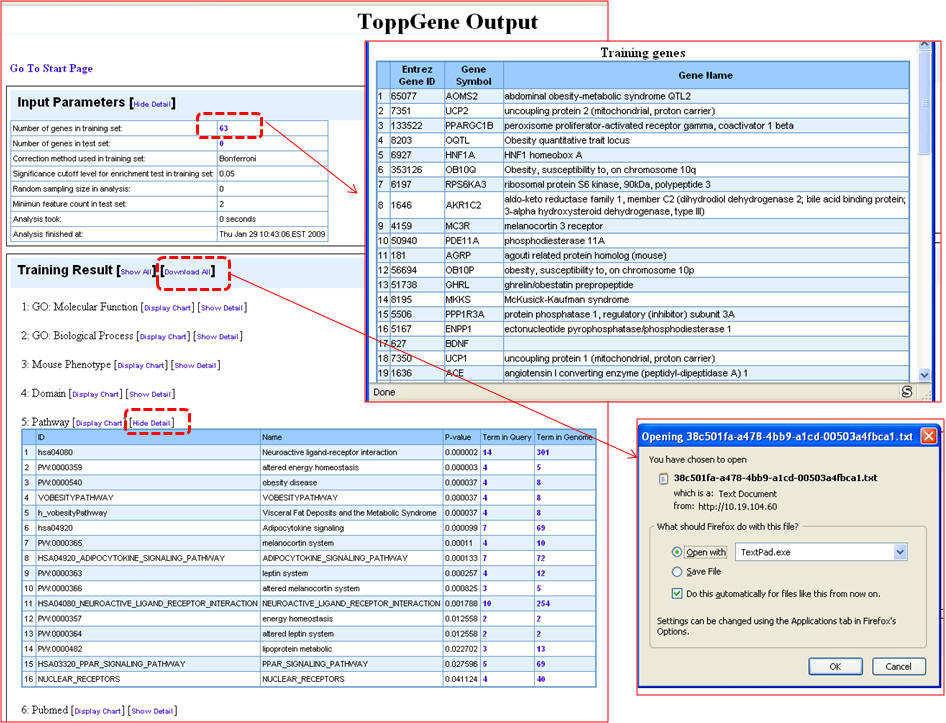
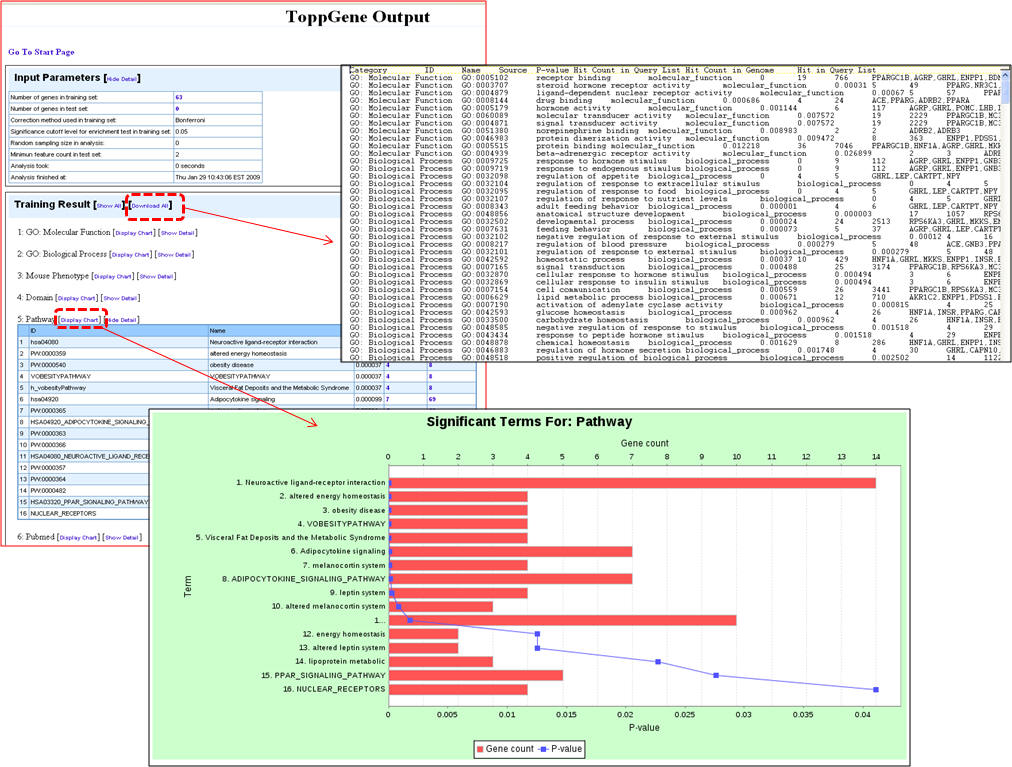
5. Once the query is processed, the summary "Toppgene Output" screen lists the input parameters and the results. Clicking on the "Show Detail" link opens a pop-up box to see the enriched terms along with p-valuesgene li
b. Using ToppGene for disease gene prioritization based on functional similarity to training set genes
Query: To rank or prioritize a list of genes (test set) by functional annotation similarity to training set.
Here, we will use a list of known obesity associated genes compiled from NCBI's OMIM and Entrez Gene as the training set. The test set is built by creating an artificial linkage interval using a GWAS identified/confirmed obesity genes. In this case, we have used MC4R gene as the candidate gene. The test set is generated by adding 99 nearest neighboring genes of MC4R on the chromosome (99+1=100 test set genes) (see Supplementary File 2 for the lists of training and test set genes) .
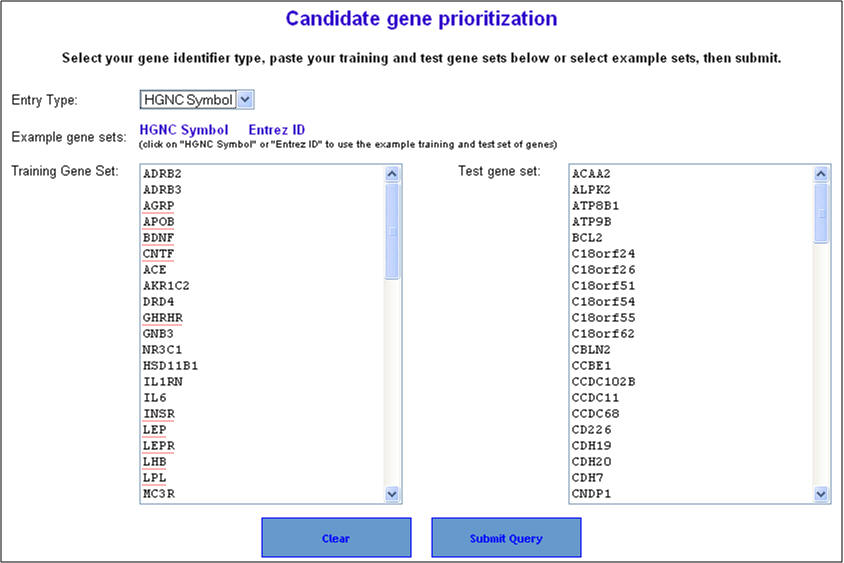
1. From the homepage click on the second link ("ToppGene: Candidate gene prioritization")
2. On the following page ("Candidate gene prioritization"), enter either gene symbols or Entrez gene IDs, and click "submit query".
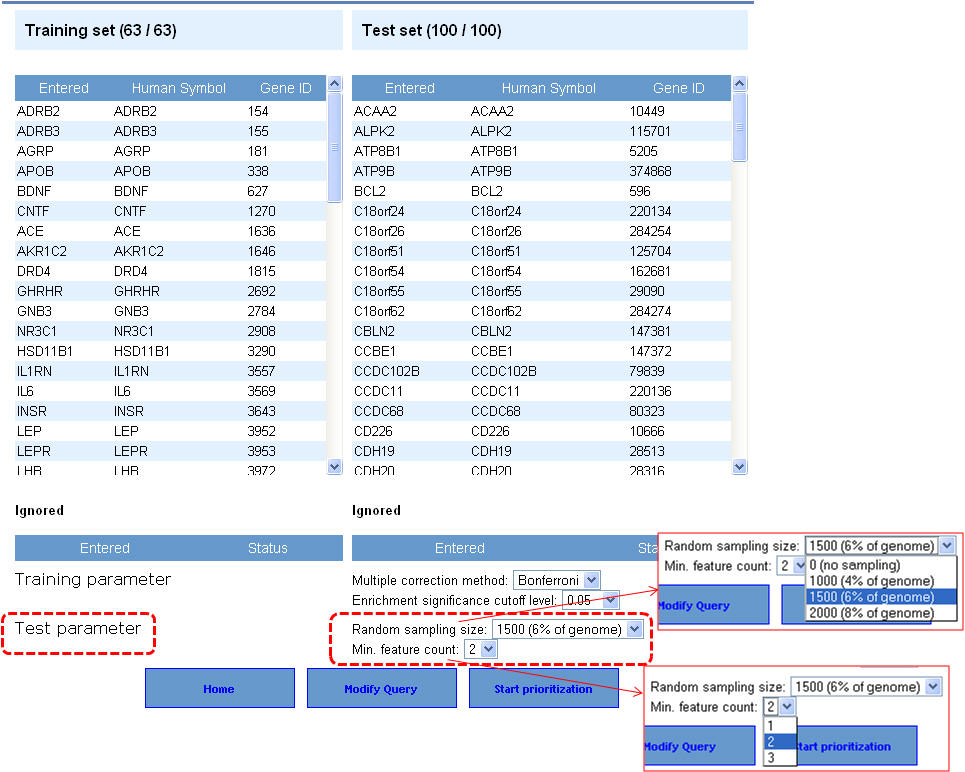
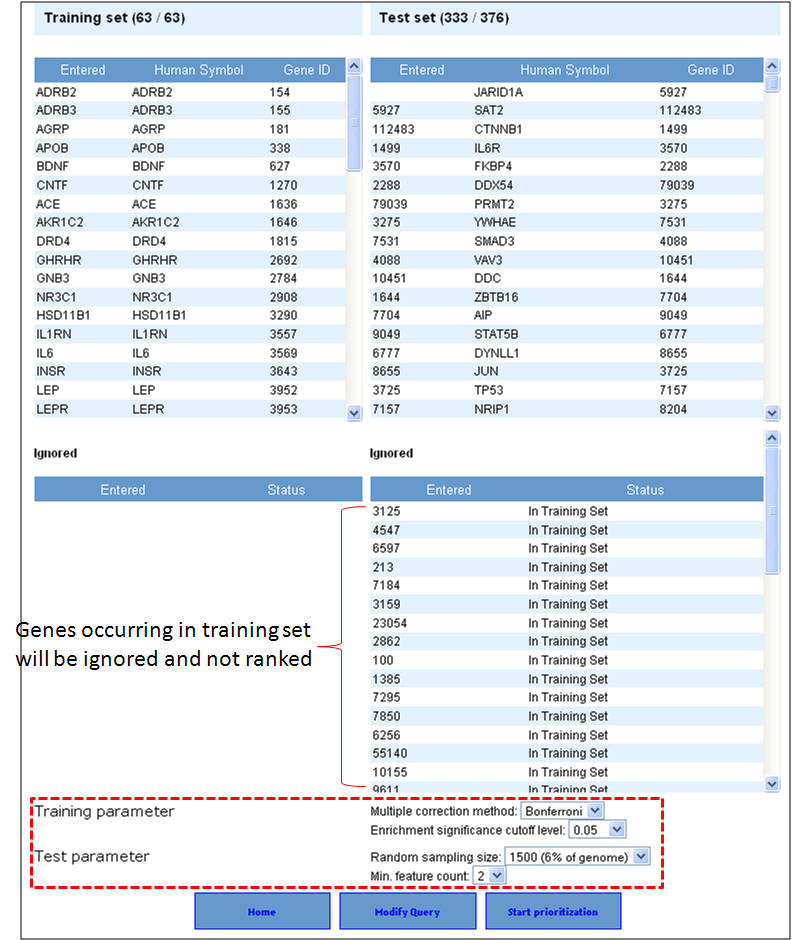
3. Select the appropriate statistical parameters. The "random sampling size" option is for selecting the background gene set from the genome for computing the p-value while the "Min. feature count" represents the number of features that need to be considered for prioritization. The default options are 6% of the genome (or 1500 genes from a total of 25000 genes) for random sampling size and feature count is 2. As described earlier in the enrichment analysis, if your gene lists contain alternate symbols or duplicates they are ignored or presented with the option to resolve them and add them back to your input list. Additionally, if there are common genes between training and test sets (i.e. test set genes which are also found in training set), these will be removed from the test set and no ranks will be assigned to them. After selecting the appropriate statistical parameters (training and test) click on the "start prioritization" button.
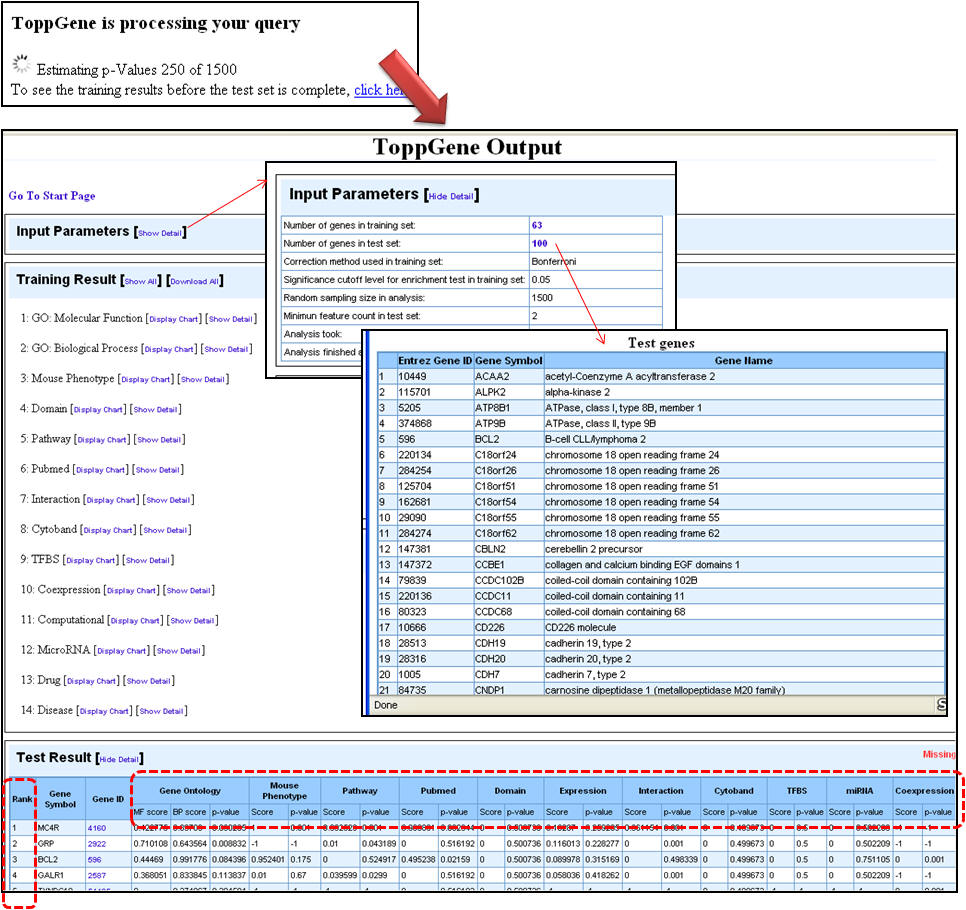
4. Once the analysis is complete, the first half of the results page is similar to what you have seen under enrichment analysis results except that the input parameters show the test set genes also. The prioritized list of test genes sorted according to their ranks based on the p-values are displayed in the lower half. Each column indicates the features used to compute similarity between training and test set.
c. Using ToppNet for disease gene prioritization based on topological features in protein-protein interactions network (PPIN)
Query: To rank or prioritize a list of genes (test set) based on topological features in PPIN.
We will again use the same list of known obesity associated genes compiled from NCBI's OMIM and Entrez Gene as the training set. The test set, as described earlier, is built by creating an artificial linkage interval using a GWAS identified/confirmed obesity genes. In this case, we have used MC4R gene as the candidate gene. The test set is generated by adding 99 nearest neighboring genes of MC4R on the chromosome (99+1=100 test set genes) (see Supplementary File 2 for the lists of training and test set genes). Both the training and test set genes are mapped onto the global PPIN and then the test set genes are scored based on how "close" they are to the training set genes.
1. From the homepage click on the third link ("ToppNet: relative importance of candidate genes in networks").
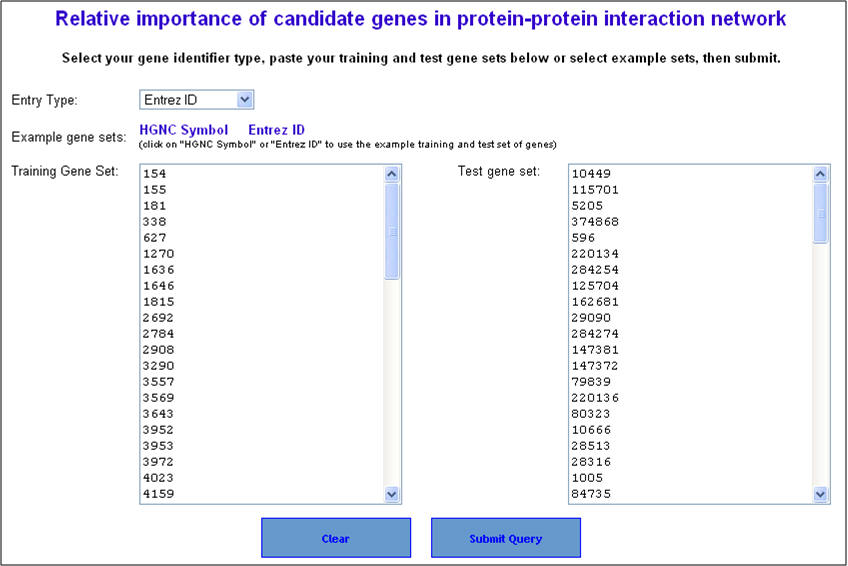
2. On the following page ("Relative importance of candidate genes in protein-protein interaction network"), enter either gene symbols or Entrez gene IDs, and click "submit query".
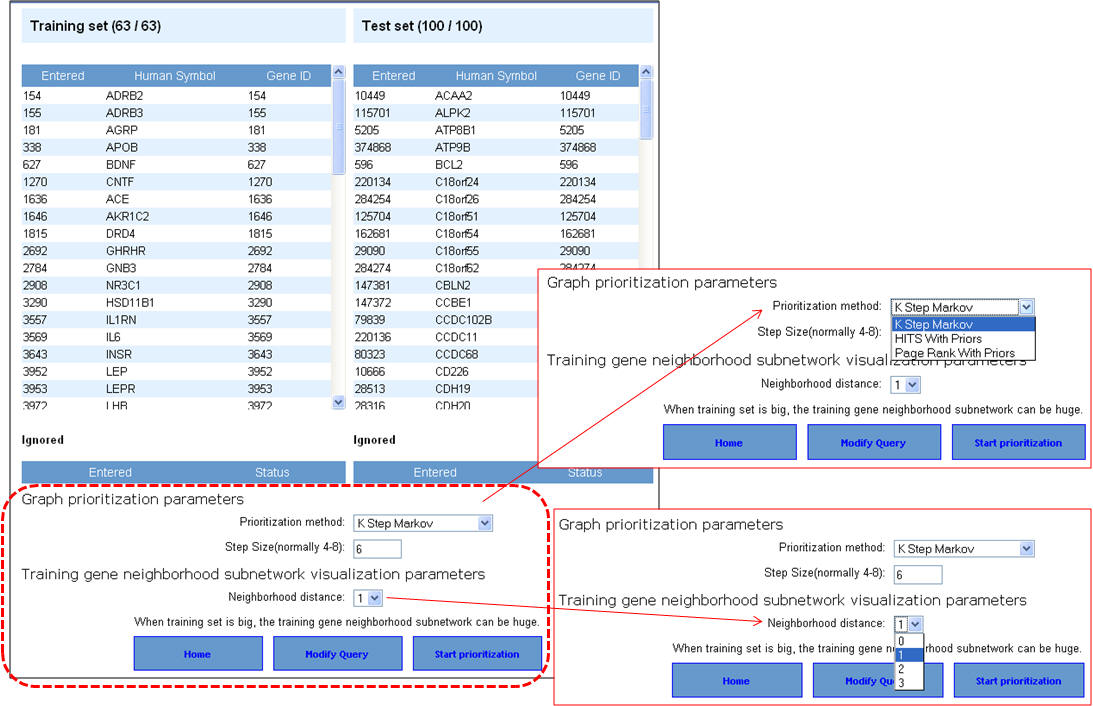
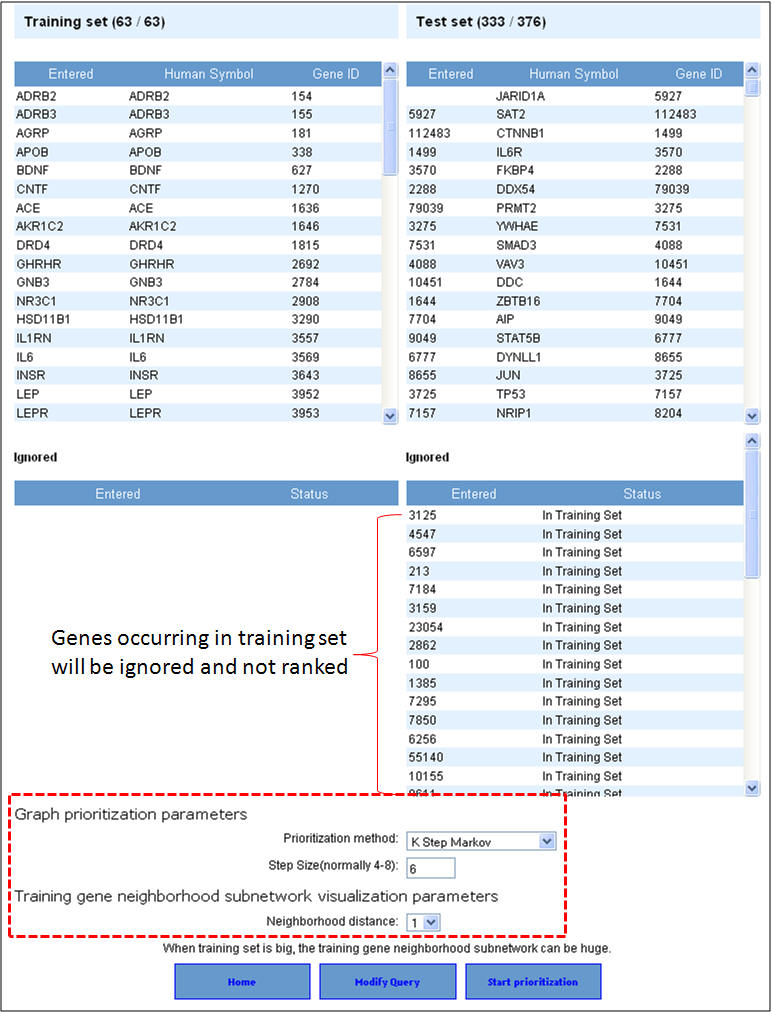
3. Select the network prioritization parameters. There are 3 options available (i) K Step Markov (default); (ii) HITS with Priors; and (iii) Page Rank with Priors. Also select the training gene neighborhood subnetwork visualization parameters (default is level 1) and then hit "Start prioritization" button.
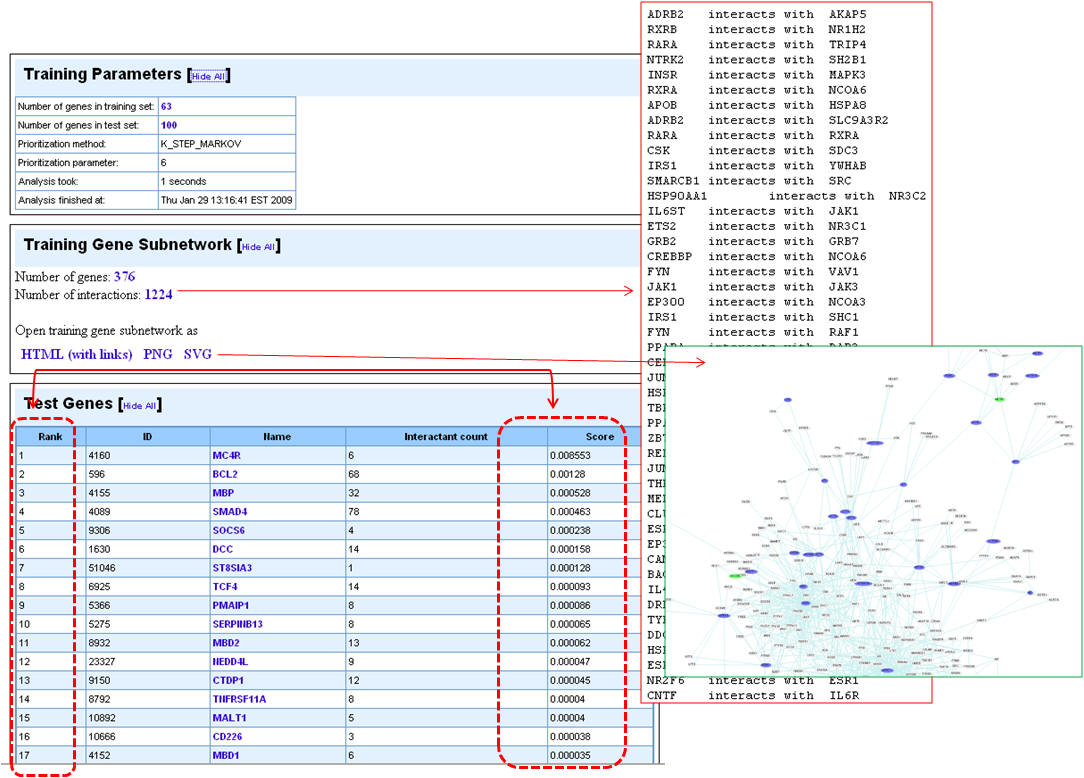
4. Following the prioritization, the test set genes are ranked according to the score. The training gene subnetwork can be exported as a Cytoscape-compatible file. Additionally, the graphical representations of the training gene subnetwork are also presented.
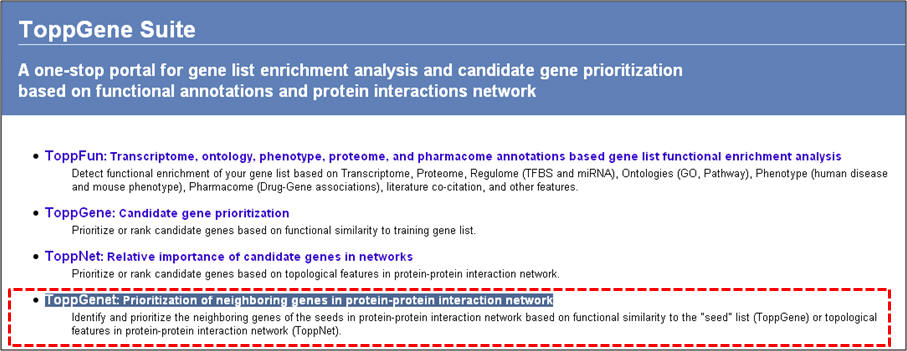
d. Using ToppGenet to identify and prioritize the neighboring genes of the "seeds" or training set in protein-protein interactions network (PPIN)
Query: To rank or prioritize a list of genes in the interactome of training set genes using either functional similarity (ToppGene) or PPIN analysis (ToppNet).
We will continue using the same list of known obesity associated genes compiled from NCBI's OMIM and Entrez Gene as the training set. The test set this time will be composed of genes that are interacting with the training set of genes (level 1 = immediate interactants).
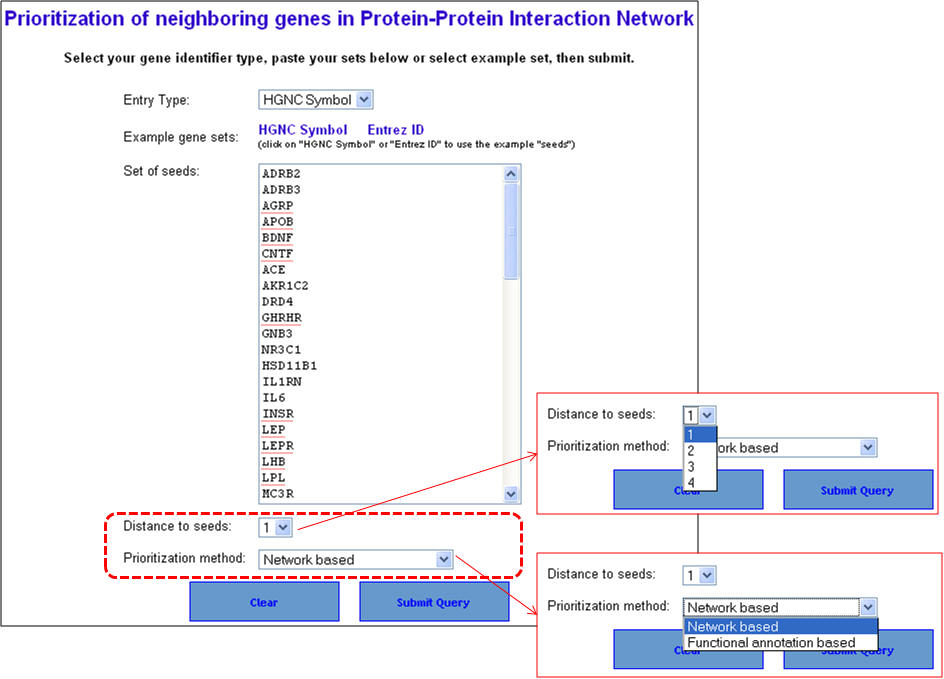
1. From the homepage click on the fourth option ("ToppGenet: prioritization of neighboring genes in protein-protein interaction network").
2. Enter the gene symbols and select the options as to how much interactome space you want to be considered, and whether you want to prioritization of the interactome genes to be done by functional similarity (ToppGene) or network analysis (ToppNet). When you select "distance to seeds" as 1, it means that the test set comprises all genes that are immediate interactants of the training set genes. Any overlapping or common genes between the training and test sets will be ignored from the test set and not considered for ranking.
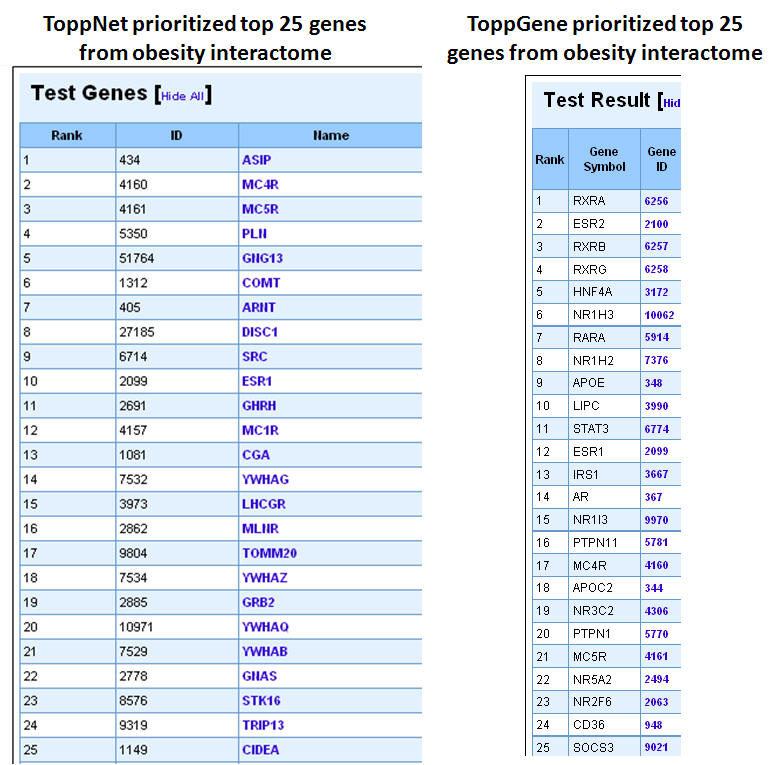
3. In this example extending the interactome to "level 1" fetches 376 genes which are used as test set after removing the common genes (i.e. those present in the training set too). The final test therefore comprises 33 genes (376-43). The first panel shows the prioritization done through PPIN analysis (ToppNet) while the lower panel shows the prioritization done based on functional similarity (ToppGene).
4. Below is a list of top 25 genes prioritized using ToppNet and ToppGene.